Plants
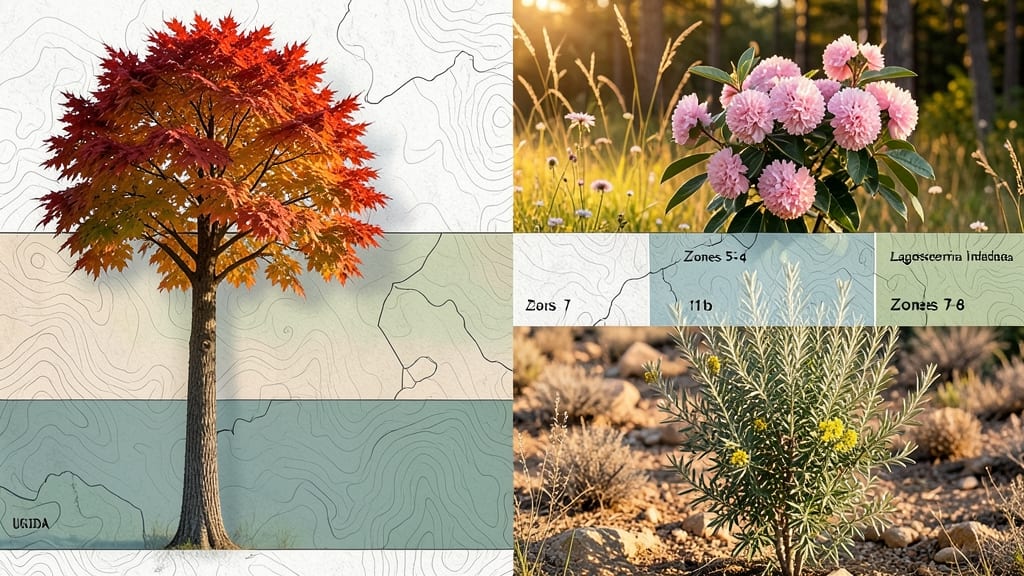
American garden zones classify regions by average minimum winter temperatures to determine which plants will thrive in your area, using a 10°F increment scale from Zone 1 (coldest) to Zone 13 (warmest).
Understanding your USDA Plant Hardiness Zone helps you choose plants that survive local winters. 🌱 These zones are based on 30-year averages of the coldest temperatures, with each zone spanning a 10°F range—for example, Zone 5 ranges from -20°F to -10°F. The system accounts for regional climate shifts, so checking your zone annually ensures you're planting the right species.
I always verify my zone using the interactive USDA map, which accounts for elevation and microclimates that can vary even within a neighborhood.
Once you know your zone, you can select perennials, shrubs, and trees that match its temperature range. For instance, peony bushes thrive in Zones 3-8, while bougainvillea needs Zones 9-11.
Extreme weather events, like heatwaves or late frosts, may require additional protection for borderline plants. Many nurseries now label plants with their hardiness zones, making it easier to shop with confidence.
💡 In This Article
- How USDA Plant Hardiness Zones Work
- Finding Your Zone and Best Plants for It
How USDA plant hardiness zones work
The USDA Plant Hardiness Zone Map divides North America into 13 zones, each representing a 10°F difference in average annual minimum winter temperatures.
Zone 1 (-60°F to -50°F) covers the coldest regions like Alaska, while Zone 13 (60°F to 70°F) includes the warmest areas like South Florida. This system relies on 30-year climate averages collected by NOAA, ensuring it reflects long-term trends rather than short-term fluctuations.
The science behind these zones involves measuring how cold temperatures affect plant tissues. Most plants survive when their cells remain hydrated and membranes stay intact. Below -25°F, many plants experience freeze damage as ice crystals form inside cells, rupturing them.
The zone system helps gardeners avoid planting species that won’t tolerate their area’s extremes. For example, a Zone 6 plant (typical of Chicago) won’t survive a -30°F winter in Zone 4 (like Minneapolis). 🌡️
Zones aren’t static—they shift due to climate change. Since the 1990s, average temperatures have risen by 2-3°F in many regions, causing zones to creep northward. The 2012 USDA map reflected these changes, moving some areas up a full zone.
This means plants that once struggled in your zone may now thrive. However, extreme weather—like late spring frosts—can still challenge borderline species, requiring gardeners to adjust planting times or use protective measures.
Beyond temperature, zones account for elevation and microclimates. A hilltop might be 5°F colder than a valley just a mile away, while a south-facing wall can add 5-10°F of warmth. These variations explain why two neighboring yards might have different growing success.
The USDA map provides general guidance, but local observations—like tracking frost dates—help fine-tune plant choices. For instance, a Zone 7 garden in Atlanta might safely grow camellias (Zone 7-9), while one in Denver (also Zone 7) may need to protect them from dry, cold winds.
Plant survival rates also depend on acclimation. Many perennials harden off in fall, becoming more cold-resistant. For example, daylilies (Zone 3-9) can survive -30°F if established, while young plants may need mulch.
The zone system simplifies this by grouping plants with similar cold tolerance, but gardeners should still consider a plant’s maturity and care when pushing zone limits. A well-mulched Zone 5 rose might survive a -20°F winter in Zone 4 with extra protection.
Understanding these zones helps explain why some plants thrive in one region but fail in another. For example, blueberries (Zone 3-7) need acidic soil and cold winters to produce fruit, while citrus trees (Zone 9-11) can’t tolerate frost.
The zone map acts as a starting point, but successful gardening often involves testing plants at the edges of their zones and adapting to local conditions. 🌿