Tools
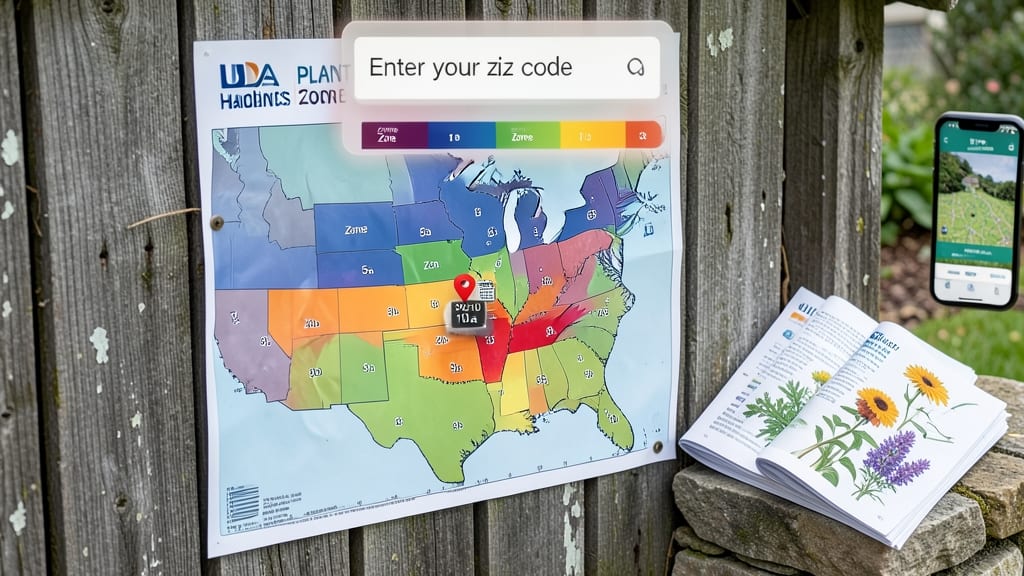
To find your garden zone by zip code, use the USDA Plant Hardiness Zone Map online tool by entering your address, which reveals your official USDA zone (like Zone 7a) based on average annual minimum temperatures. For accuracy, adjust for local factors such as elevation or urban heat differences.
The USDA Plant Hardiness Zone Map is the gold standard for gardeners, dividing the U.S. into 13 zones based on average coldest winter temperatures. 🌱 For example, Zone 5 endures -20°F to -10°F winters, while Zone 9 rarely drops below 20°F. This system helps predict which plants will thrive in your area, but remember: your actual growing conditions might vary.
Urban areas often run 5-10°F warmer than rural zones, while mountain slopes can be colder even at the same elevation. Always verify your zone before buying plants, and consider testing your microclimate by observing where frost forms in your yard.
Pro tip: The USDA updates its map every 10 years using long-term weather data, so check for the latest version. For extra precision, try local climate tools that overlay satellite heat maps or wind patterns onto your property. This can reveal hidden microclimates where certain plants might flourish unexpectedly.
💡 In This Article
- How USDA Plant Hardiness Zones Determine Your Garden Climate
- Adjusting Your Zone for Microclimates: Sun, Shade, and Local Factors
How USDA plant hardiness zones determine your garden climate
The USDA Plant Hardiness Zone Map divides North America into 13 main zones (1-13), each further split into 'a' and 'b' subzones representing 10°F temperature differences. For example, Zone 7a ranges from -10°F to 0°F, while Zone 7b spans 0°F to 10°F.
These zones are calculated using 30-year averages of the coldest winter temperatures, which is why the map updates every decade—climate change shifts these averages over time. 🌡️ The science behind this involves analyzing historical weather data from thousands of weather stations across the country.
What makes this system so precise? The USDA uses average annual minimum temperatures because most plants die when exposed to temperatures below their hardiness threshold. For instance, a plant rated for Zone 6 won't survive a -20°F winter (Zone 5), but might thrive in Zone 6's -10°F to 0°F range.
The 10°F increments between zones reflect how much colder conditions become as you move northward or upward in elevation. This granularity helps gardeners select plants that have a 90% chance of survival in their specific zone.
While the USDA system focuses on winter hardiness, other climate classification tools like the AHS Heat Zone Map address summer heat tolerance. These maps use average July temperatures to categorize regions, helping gardeners understand which plants can handle their area's summer extremes.
For example, a Zone 9 area might experience 90-100°F summers, which is critical for selecting heat-tolerant vegetables like okra or sweet potatoes. 🌿 Comparing both systems gives you a fuller picture of your garden's climate challenges.
Here's where it gets interesting: the USDA zones are based on large-scale climate patterns, but your actual backyard might experience microclimates that differ by several degrees.
A north-facing wall, for instance, can create a 5°F cooler microclimate than the rest of your yard, while a south-facing slope might be 3-5°F warmer. This is why simply knowing your USDA zone isn't always enough—you'll need to observe your property's unique conditions to fine-tune your plant selections.
To put this into perspective, consider how elevation plays a role. Every 1,000 feet of elevation gain typically drops temperatures by 3.5-5°F. So if you live at 500 feet in Zone 7b, a hilltop at 2,500 feet might actually experience Zone 5 conditions.
This is why mountain gardeners often plant zones 3-5 zones lower than their official USDA designation. The same principle applies to urban areas, where asphalt and buildings can create heat islands that push temperatures up by 5-10°F compared to rural zones.
The USDA system also accounts for low-probability extreme events, like the once-in-10-year cold snap that might drop temperatures 10°F below the zone average. This is why gardeners in marginal zones often use season extension techniques, like row covers or cold frames, to protect tender plants.
Understanding these nuances helps you make informed decisions about which plants to push the limits with—and which to avoid entirely. 🌱